Data-Analysis-Portfolio
Data analysis projects
Project maintained by rasulov94 Hosted on GitHub Pages — Theme by mattgraham
Table of Contents
1. Project and task description
2. Data Preprocessing
3. Study and check the data
4. Study the event funnel
5. Study the results of the experiment
Project Description
A Startup sells food products. Investigate user behavior for the company’s app.
Each log entry is a user action or an event
EventName — event name
DeviceIDHash — unique user identifier
EventTimestamp — event time
ExpId — experiment number: 246 and 247 are the control groups, 248 is the test group
Then look at the results of an A/A/B test. The designers would like to change the fonts for the entire app, but the managers are afraid the users might find the new design intimidating. They decide to make a decision based on the results of an A/A/B test.
The users are split into three groups: two control groups get the old fonts and one test group gets the new ones. Find out which set of fonts produces better results.
Creating two A groups has certain advantages. We can make it a principle that we will only be confident in the accuracy of our testing when the two control groups are similar. If there are significant differences between the A groups, this can help us uncover factors that may be distorting the results. Comparing control groups also tells us how much time and data we’ll need when running further tests.
Task
- First study the sales funnel.
- Find out how users reach the purchase stage.
- How many users actually make it to this stage?
- How many get stuck at previous stages? Which stages in particular?
Data Preprocessing
We have prepocessed the data and the following changes have been made:
- Columns were renamed for the sake of readability.
- No missing values were found.
- 413 duplicated values were detected and removed.
event_datetimecolumn converted to datetime type; dates were extracted on separate columnevent_dateand time exracted and saved toevent_timecolumns.
Study and check the data
- Average number of events per user.

- What period of time does the data cover?

As we see from histogram above, all the events occured from 2019-07-31, meaning on the second week of the testing period which is the actual period that our data represents. Thus, we can filter out data and keep only relevant ones which is after 2019-07-31.
Study the event funnel
- Find the number of users who performed each of these actions. Sort the events by the number of users.

- What share of users make the entire journey from their first event to payment?
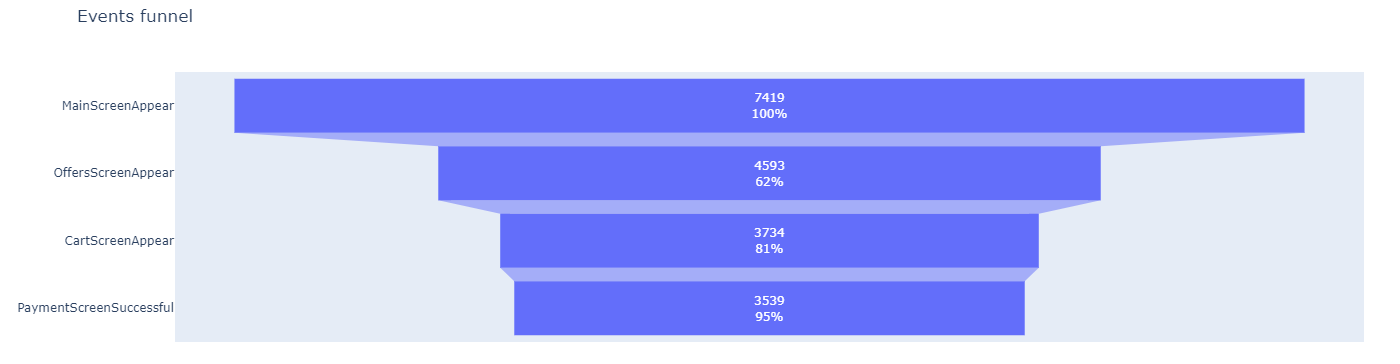
48 % of users make the entire journey from their first event to payment.
Study the results of the experiment
- We have two control groups in the A/A test, where we check our mechanisms and calculations. See if there is a statistically significant difference between samples 246 and 247.


Note: Critical significance level (alpha) : .05
In the final step, we have studied the results of the experiment and conducted several hypotheses. Followings are the outcomes:
- We have the highest number of users –> 2,537 in our test group (number 248) followed by control group 247 with 2,513 users
- Having 3 different experiment groups, it is important to ensure that that the samples are the same. In order to do so, we want to check if there is a statistically significant difference between all of the control groups. If we find that there is a significant difference, then the control groups have been split up unequally andresults will not accurately represent the population.
- We have calculated the p-value for all events of two experiment groups. The results tell us not to reject the H0 for all events. Thus, we can proceed with further experiment groups.
MainScreenAppearis the most popular event in both control groups. For group 246, 2450 users performed that action and for control group 247, 2476 users performed the same action. 98 % of total users of each group have performed this action. The outcomes tells us that the groups were split properly since we failed to reject the null hypothesis that implied there is statistically significant difference between groups.- We have compared both control groups with test group. All of the outcomes lead to failure of H0 implying that there is no statistically significant differences between sample groups.
- With the Bonferroni correction, we have adjusted the alpha = 0.0033. Moreover we have observed no change in hypotheses outcomes. Overall, we can conclude that changes in fonts do not have influence on the conversion.