Data-Analysis-Portfolio
Data analysis projects
Project maintained by rasulov94 Hosted on GitHub Pages — Theme by mattgraham
Table of Contents
1. Project description
2. The Analysis Overview
3. Overall Conclusion
Project description
The task is to help optimize marketing expenses of the application which is available for both desktop and mobile user that provides online upcoming events. We were provided datasets to work with and come up with suggestions.
The analysis overview:
- Average daily/weekly/monthly active users plotly visualization:
- Average session per day (# sessions / # of users for period)
- Duration of the session (end_time - start_time)
- Cohort analysis
- Retention & Conversion calculation
Overall Conclusion
The ultimate goal of this analysis was to optimize marketing expenses by calculating business metrics of Yandex.Afisha.
Before jumping right into analysis, we had to do data preprocessing, getting the dataset cleaned and accurate. We have looked through each columns of the dataset and made decisions on preprocessing. The following changes have been made:
All columns of our dataframes were replaced with lowercase letters
All columns of our datasets were changed to certain types (e.g. device column to category type) for the sake of optimization.
All columns containing dates were changed to datetime formats(e.g. start_ts and end_ts columns to datetime).
Dataframes were checked for duplicates and missing values.
Next step which was calculating business metrics on product we have looked through the followings:
Total daily/weekly/monthly active users = 908, 5,724 and 23,228 respectively; plotted a graph to see the user activity.

Users on average have 1 session per day.
Average length of sessions were not distributed normally, therefore we took the mode = 60 seconds each session’s duration.
Retention rates were following the logical pattern where users’ possibility to come back to app gets higher as the time passes which implies higher retention rates in earlier days comparing to later. We have looked retention rates both by cohorts and source id to see when and from which source users mostly come back. Results show that most users come from sources 1 and 2. November 2017 cohort has the highest retention rate = 2.28% on user’s 1st day meaning the next day after their registration.

In our further step which was calculating business metrics on sales we have looked through the followings:
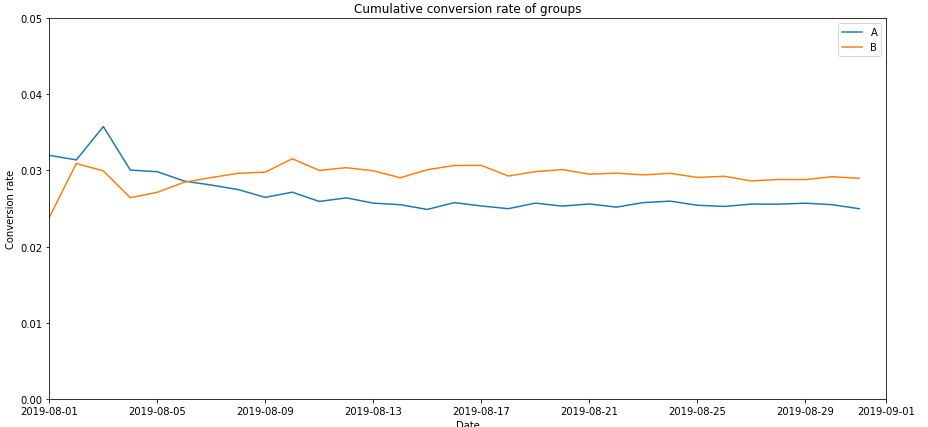
Conversion rate that tells us when do people start buying. Conversion rates also differ across cohorts and source ids. We have calculated conversion rate by source id and cohorts to see when users buy stuff and from which source. Important nuance to mention that conversion rates are cumulative metric which means we will calculate for period inclusive all dates. For example if we look at conversion rate within a month (30 days) we take into account all users who made a purchase within this period.And the results showed us that users coming from source 1 make more purchases than any other source. June 2017, had the highest conversion rate of 16 %.
Number of orders across cohorts also are different. That could be explained by the seasonality of the product.November 2017 shows us that user made more orders than any other month throughout reporting peroid. There is also robust reason which is the Black Friday which takes place on the Last Friday of November each year.

Following orders we have calculated the average purchase size that coincides with November month showing the significant incrase in average revenue per user where they made most orders. Average Life-time value of users tells us how much a user brought to the company throughout their active purchase on Yandex.Afisha. Lifetime revenue per user differs across cohorts mostly because of seasonality as we have mentioned before. Let us take examples of two cohorts with the highest revenue per user’s lifetime. July 2017 which is our first cohort, on average each customer brough 11.88 USD in revenue over their eleventh-month lifetime, whereas September 2017 cohort users brought 13.44 USD within thier eighth lifetime.

The next step was calculating metrics on marketing mainly return on marketing investment and cost of acquisition.
We have analysed how much money was spent overall/per source/over time. Source 3 had the highest expenses where 42.9 % of our investment goes to only source 3 followed by source 4 with 18.6% of total expenses. The company had higher revenue in 2017 and consequently more investments followed in the same year.

Customer acquistion from each source are different. It is also important to mention that we have to take into account only those visitors who converted to buyers not all visitors. Source number 3 has the highest cost of advertisement and higher CAC = 10. 2 USD comparing to other sources which their CAC lie between 2-5 USD. The CAC of source 3 almost doubles the cost of acquisition of other sources. We can see that company invests and focuses on source 3 a lot.
Finally, Return on Marketing investment was calculated. For a company to be on a profit side, it must have its LTV greater than CAC. The results show the same pattern. For the first cohort, acquiring each customer cost the company an average of 8.90, while each customer brought in 11.87. Return on marketing expenses differ across cohorts as well. For instance, September 2017 cohort paid off after 3 months while cohorts after Septermber have not yet. This implies that the average time to recoup marketing investments are longer than 3 months. On average, cohorts pay off toward the end of the 8th month.

The conclusion is that for planning advertising campaigns, we have to be careful about the sources in which we invest our money. It is better to diversify investment portfolios. It is a must to consider that for marketing investments to pay off one customer acquisition can not cost more than $9.0835. Since our customers bring that amount of money in the 8 month period which is also the time to pay off.