Data-Analysis-Portfolio
Data analysis projects
Project maintained by rasulov94 Hosted on GitHub Pages — Theme by mattgraham
Hello, World! Welcome to my data analysis portfolio comprised of real-world case studies. Feel free to dive into the world of data and business analytics.
Languages & Libraries:
- Python, Jupyter notebook, SQL, Excel, Tableau
- Pandas, Numpy, Seaborn, Matplotlib, Plotly, Stats
Project: Statistical Hypotheses Testing
Description
Together with the marketing department, we’ve compiled a list of hypotheses that may help boost revenue.
We need to prioritize these hypotheses, launch an A/B test, and analyze the results.
Research Questions
- Prioritize hypotheses
- Launch an A/B test
-
Analyze the results
-
Prioritize hypotheses through ICE (ImpactConfidence/Effort) and RICE (ReachImapact*Confidenc/Effort)
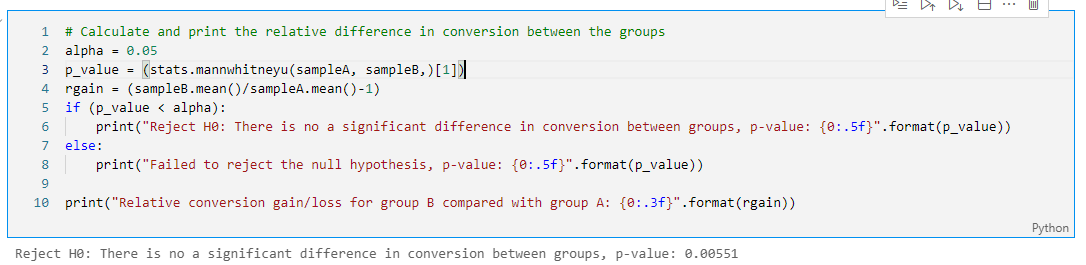
- Test statistical hypotheses using Mannwhitneyu statistics
- Conclusion & recommendations
Findings:
- There’s a statistically significant difference in conversion between the groups, according to both the raw and the filtered data. Group B has higher conversion rate than group A.
- The raw data didn’t show a statistically significant difference between the groups in terms of average purchase size in both raw and the filtered data.However, after the anomalies were removed, the relative difference became smaller.
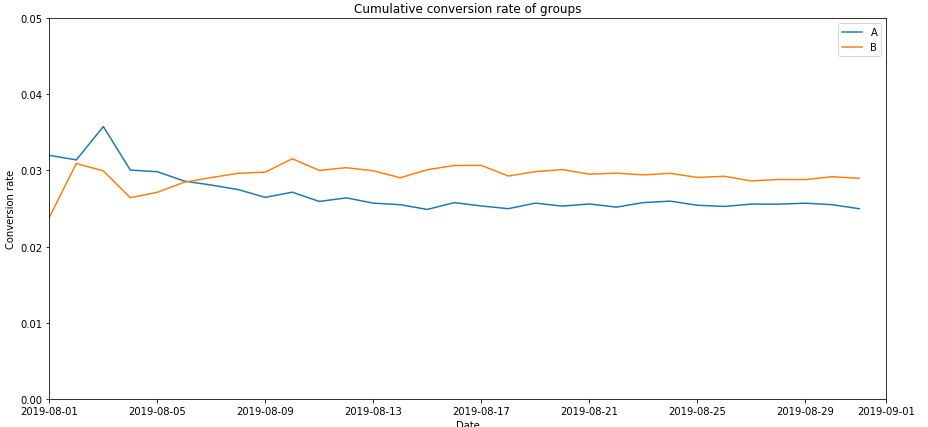
- The graph of the difference in conversion between the groups shows that group B’s results are better than those of group A: conversion rates of both groups seem to be stabilized after the first week of testing period. Overall, the conversion rate of group B is slightly higher than the conversion rate of group A.
More details: click here
Business Analytics Project: Optimizing marketing expenses
Description
Analysing user’s behavior and calcuation of business metrics such as retention, conversion, life-time value, cost of customer acquisition.
Datasets:
- Server logs with data on Yandex.Afisha visits from June 2017 through May 2018
- Dump file with all orders for the period
- Marketing expenses statistics
Research Questions:
- How customers use the product
- When they begin to purchase
- Revenue generated from each user
- When users pay off
Findings:
- The conclusion is that for planning advertising campaigns, we have to be careful about the sourcses in which we invest our money and it is better to diversify investment portfolios rather than placing everything in one basket.
- It is a must to consider that for marketing investments to pay off one customer acquisition can not cost more than $9.0835. Since our customers bring that amount of money in the 8 month period which is also the time to pay off.
More details: click here
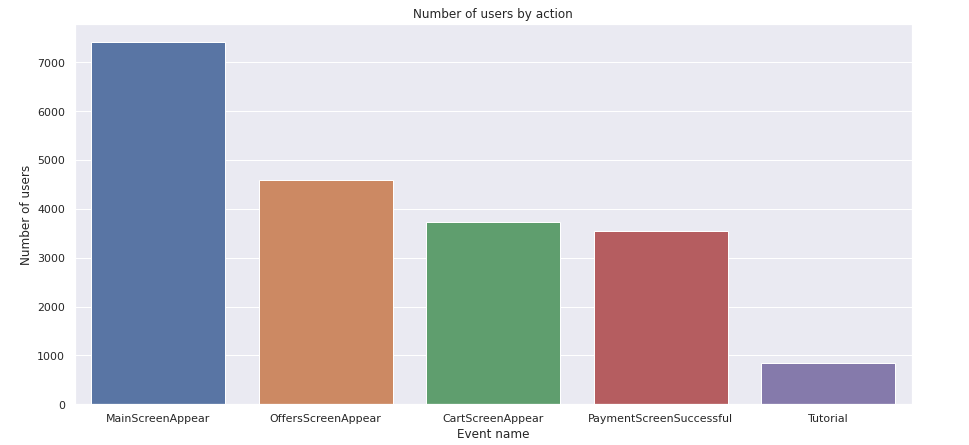
Project: Conducting A/A/B testing, Studying Sales Funnel
Description
The goal of the project is to test whether additional feature on the app will be successful or not.
Research Questions
- Import and preprocess datasets
- Exploratory data analysis
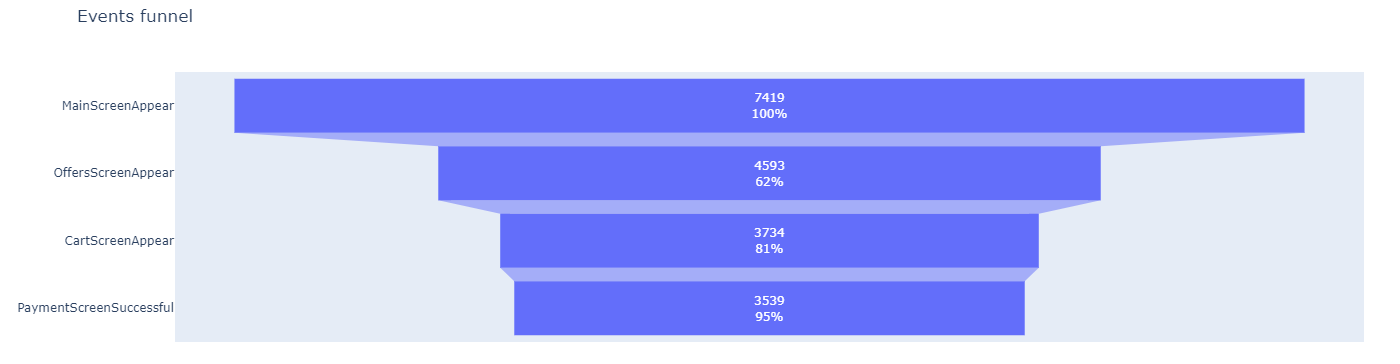
- Study events funnel
- Results of the experiment & recommendations
Findings:
-
Having 3 different experiment groups, it is important to ensure that that the samples are the same. In order to do so, we want to check if there is a statistically significant difference between all of the control groups. If we find that there is a significant difference, then the control groups have been split up unequally and results will not accurately represent the population.
-
We have calculated the p-value for all events of two experiment groups. The results tell us not to reject the H0 for all events. Thus, we can proceed with further experiment groups.
-
We have compared both control groups with test group. All of the outcomes lead to failure of H0 implying that there is no statistically significant differences between sample groups.
-
With the Bonferroni correction, we have adjusted the alpha = 0.0033. Moreover we have observed no change in hypotheses outcomes. Overall, we can conclude that changes in fonts do not have influence on the conversion.
More details: click here
Project: Forecasting customer churn
Description
The gym chain Model Fitness is developing a customer interaction strategy based on analytical data. Analyze customer profiles and come up with a customer retention strategy.
Research Questions
- Import and preprocess datasets
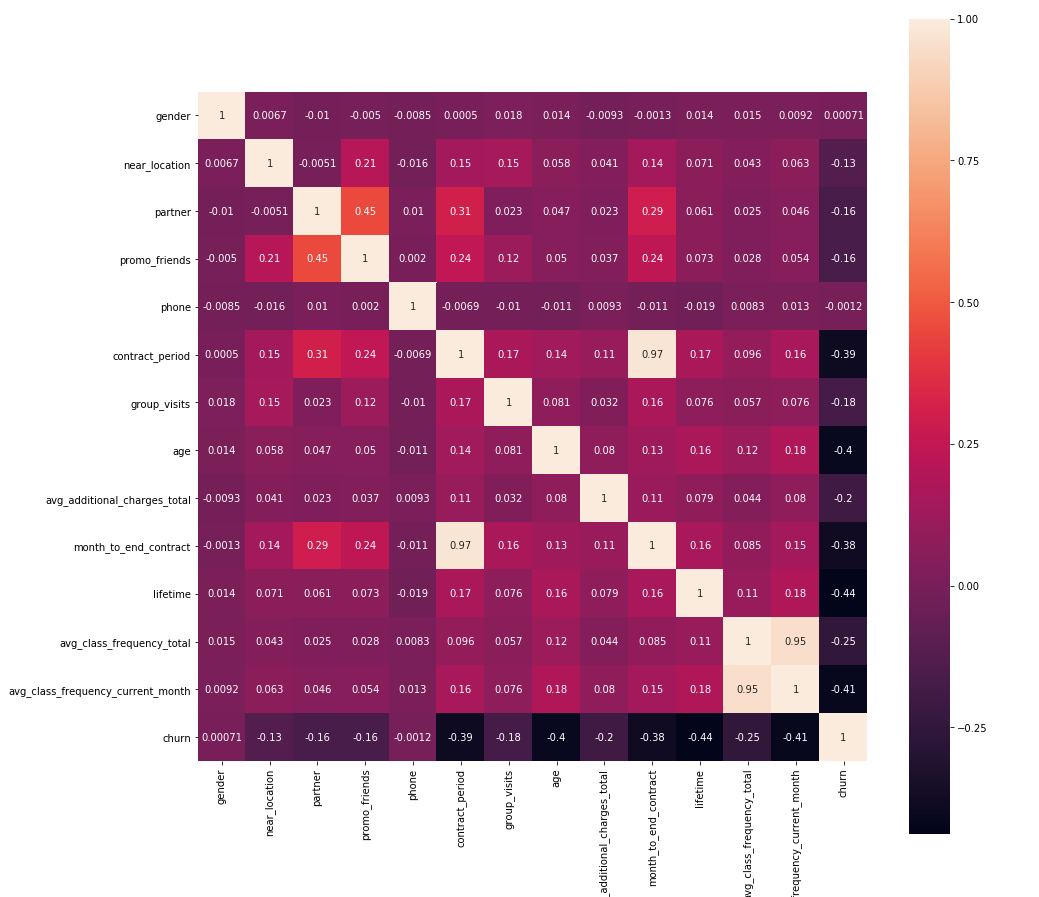
- Exploratory data analysis
- Build a model to predict user churn
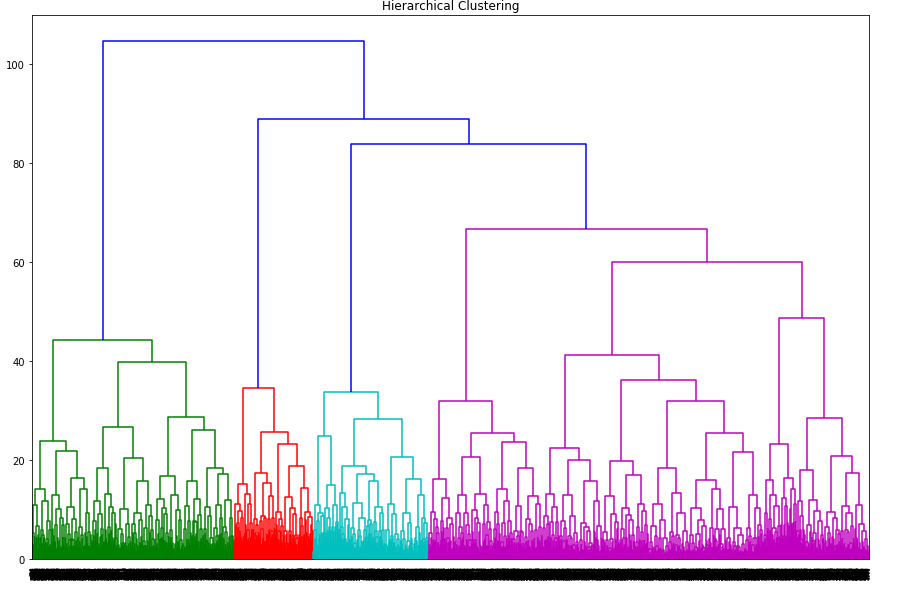
- Create user clusters
- Results of the experiment & recommendations
Findings:
Recommendations for betterment customer retention and lower churn rates are the following:
- For acquiring new customers, we should focus on customers that live near to gym location, who are employees at a partner company and between the ages of 27 and 32 years. The data shows that customers who fall under one or (ideally) all of these categories are less likely to churn.
- For already existing customers, encourage them to spend more money on other gym services and services and increase their amount of weekly visits by providing discounts on products. These are all factors that make a customer less likely to churn.Example could be providing special training courses or showing live events in bars make visitors to stay longer or come more often. Additionally, we focus on customers who have 1-2 months before their current contract ends. This is when customers are more likely to decide whether to continue their subscription or not.
- Not to forget about our main target. The most loyal customers are those who are between the ages of 27 and 34, who spend the most on other gym services, who live near the location, who are employees at partner companies, who spend money on additional gym services and who visit the gym about 2 times on a weekly basis.
More details: click here